
Navigate through the website by clicking on the icons at the top.
Now that we have mastered incredible GFP technology, our next stop: global domination & world peace!
Day 4: Harvesting
In harvesting, this is the process of emptying the fermenter. This can be done by washing and dismantle of the fermenter.
Objective1. To know how to carry out harvesting
Wednesday, November 28, 2007
Cells (in our case E. coli) are delicate and require a great deal of attention to detail for them to grow well. A slight change to their surroundings can vastly affect their ability to reproduce and generate products. Oxygen is required for most microbes to live and grow, however if in excess, it is toxic! The high oxygen generates free radicals, high levels of free radicals affects their cell growth and may even kill them. However oxygen also has a low solubility in water which makes it necessary for us to introduce methods which will allow for enough oxygen to dissolve and meet the cell oxygen demand. Lastly, temperature is best maintained around 37 degrees Celsius as most cells grow best. Anything above a temperature of 40˚C will affect the cells, and most likely killing them since proteins will be denatured in high temperature. It is also important that the fluctuations in the temperature are kept to a minimal as a constantly changing environment is defiantly stressful for us, much more so for cells. The amount of light received by the detector is then computed and translated into a value kown as transmittance or absorbance. Cells absorbs light maximally at a wavelength of 600nm hence that wave length is used. 3. Is GFP a primary or secondary metabolite? At which phase should the product be harvested? At which phase was the product actually harvested? There are four sections to Day 3: Part I (Procedures)
Since it is said that both the pO2 level and the stirrer speed are inversely proportional, we shall explain the non-coordinated graph of pO2 and stirrer speed between time 2.5h to 5h.
With the absorbance values, we can deduce the cell concentrations from the following steps: As a result, the difference in absorbance values obtained is identical to the difference cell concentration values at each respective hour. Samples were extracted from the bioreactor for 10 hours at every hour from 9am (first hour) to 6pm (last hour). Phase (1): The lag phase Phase (2): The exponential phase As a result of the deduction, the exponential phase started at 0.8 hours until the 5th hour whereby graph rose steadily after lag phase. This was logarithmic phase, the period where the cells were expected to grow exponentially. This phase happened after the cells had adapted to the environment already. Hence, they started to grow and divided at the maximum rate. Phase (3): The stationary phase Phase (4): The death phase
1. The ampicillin and arabinose stock solution had been prepared before hand and filtered and sterilized. 2. The medium was cooled to below 50°C. Ampicillin was added until it reached a final concentration of 100μg/ml, while arabinose was added until it reached a final concentration of 0.2%. 3. The following parameters were set up: 4. The fermentor was inoculated with 100ml of seed culture (5% of fermentation medium volume). 5. The fermentation was then continued for another 24 hours.
2. The pH probe, pO2 probe, foam and level probe were installed into the top plate. Necessary adjustment of the height for the foam and level probe is carried out when necessary. 4. The exhaust condenser, air inlet and exhaust filters and manual sampler unit were installed. Further questions... (a) What is meant by calibration of the pH probe? Calibration of the pH probe is meant to set the pH point to be uniformed within the fermenter. Hence, a slight change in pH can be detected by the pH probe. (b) Why is hydrochloric acid (HCl) not suitable as a correction agent for pH? (2) For the sterilization of the bioreactor: 2. All silicone tubings except for exhaust filter and female STT coupling of sampling unit were clamped. All filters and sockets were covered with aluminium foil to protect from condensing moisture. 3. The bioreactor was autoclaved with steam at 121 degree celsius for 20 minutes. 4. The pO2 electrode was polarized for at least 6 hours and calibrated by aerating with nitrogen. 5. The addition lines were connected to peristaltic pumps. 1. Luria-Bertani (LB) medium was used for both seed-culture and fermentation media. 2. 1000ml of distilled water was added to 25g LB-powder containing bacto-tryptone, yeast extract and sodium chloride (NaCl). 3. The pH was pre-equilibrated in the powder; therefore, no equilibration was needed. 4. The media was autoclaved at 121 degree Celsius for 20 minutes. 5. Ampicillin was added to the final concentration of the media once the broth had cooled to below 50 degree Celsius. 6. The media was stored at 4 degree Celsius till inoculation. Further questions... (a) Bacto-tryptone (b) Yeast extract It provides any type of organic molecule that a growing bacteria would need and essential for cellular metabolism. Glutamate contributes as an intermediate in processes such as glycolysis, gluconeogenesis and citric acid cycle. Vitamins are bio-molecules that act as catalysts and substrates in chemical reaction. (c) NaCl (d) dH2O (e) pH (ii) What is the purpose of ampicillin? (iii) Why is ampicillin added only after autoclaving? (4) For the preparation of seed culture: 1. The pGLO transformed E. coli was streaked onto a LB/Amp (ampicillin)/Ara (Arabino) plate and was incubated for 24 hours. 2.After incubation, several colonies were obtained and transferred to the flask containing 100ml LB medium with ampicillin. 3. The flask was left in shaking incubator and incubated at 32 degree Celsius for 24 hours or at r.t.p for 48 hours. This is to facilitate the purpose of scaling-up. Further questions... (a) What is the purpose of arabinose? (b) Describe the sterile techniques used in seed preparation. (c) Why do we perform step-wise scale-up instead of transforming directly to the fermenter?
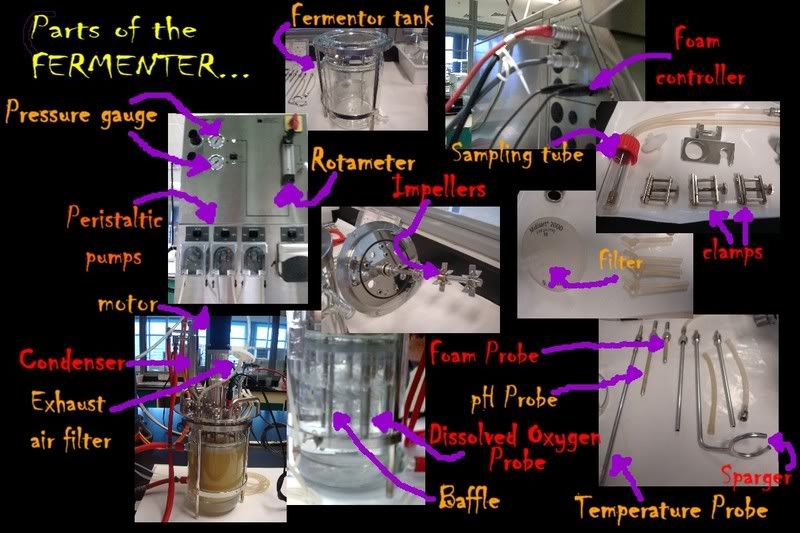
A photo of Our Savior: the beloved bioreactor Our Savior has many different important parts that serve different functions. Long live the bioreactor! 1. Motor - to drive the motion of the impeller by supplying electrical power 2. Impeller - to mix the media such that cells are prevented from settling at the bottom of the fermenter, and to distribute the bubbles evenly throughout the broth 3. Sparger - to supply sufficient oxygen and other essential gases required by sparging in air 4. Baffles - to ensure even gas and nutrient distribution, such that there is good mixing 5. Inlet air filter - to sterilize the inlet air stream and remove any possible contaminants using a 0.22nm filter 6. Exhaust air inlet - to sterilize the outlet air stream by also using filter 7. Rotameter - to measure the gas flow rate 8. Pressure gauge - to measure air pressure in the fermenter 9. Temperature probe - to measure the temperature of the media 10. Cooling jacket - to cool or heat the water 11. pH probe - to measure pH of media 12. Dissolved oxygen probe - to measure the amount of dissolved oxygen in the broth and ensure cells have obtained sufficient oxygen and other essential gas components 13. Level probe - to measure the level of the liquid in the bioreactor 14. Foam probe - to detect increasing levels of foam that may form during the run, such that the appropriate action can be taken 15. Acid / Base - to neutralise the changes incurred during the fermentation process 16. Antifoam - to prevent build-up of foam and break the surface tension to break bubbles that may coagulate during the run 17. Sampling tubes - for sampling of cultures at consistent intervals in order to monitor the growth of cells and their constituent products 18. Control panel - to settle parameters
Our blog would be in shambles if it weren't for some help from these great sources! Lots and lots of arigatou to: For pictures within The Secrets behind GFP section: Figure 1.2: Figure 1.4: Figure 1.6: Figure 1.7: Figure 1.8: (for the Pokémon picture!) For the information within The Secrets behind GFP section: http://userpages.umbc.edu/~jili/ench772/intro.html For answers to questions:
Fig. 1.2 Section 1.2: History of GFP The timeline below depicts the history and the discovery of GFP, and the brilliant scientists who contributed to its discovery. Click on the link below for a larger and clearer version: Fig 1.3 Click here for a larger and clearer diagram of the timeline. Section 1.3: Structure of GFP Fig 1.5: a scorpion fluorescing under UV light Fig 1.6: a cool animation comparing a genetically-engineered rat glowing with the help of GFP, and a normal wild-type Section 1.5: Incorporation of GFP into Escherichia coli cells 1. Aequorea Victoria cells were broken down to obtain genomic DNA that contain genes encoding for GFP. 7. The E. coli cells that contained gene of interest could be verified by placing under UV light. The arabinose present in the agar plate would activate the GFP gene to fluoresce under UV light.
Day 3, Part IV: Further Questions
Even though we had just wrote three pages full of information, there were STILL some further questions to answer! :)
1. Explain the control philosophy of pH, temperature and dissolved O2 as was used in the fermentation process.
For most cells, the optimal pH is around 6.5 to 7.0, any more or less then that places stress on the cells.
2. Describe the principle of the spectrophotometer which was used to determine the cell density (OD600). Why was 600nm used?
A spectrophotometer works by measuring the amout of light, sent out by a light source, received by the detector. The light source sends out light which are split up by a prism into various bands of differing wavelengths. An appropriate slit or device then allows the specific band of wavelength through and shines it on the sample or blank. 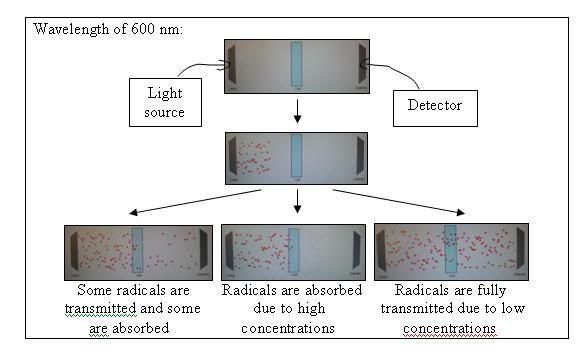
GFP is a secondary metabolite product. This product is generated during the late growth phase and throughout the stationary phase. Therefore the product should be harvested during the late stationary phase to get the maximum yield.
4. What are some advantages of using a computer control system? From the history chart, comment on the effectiveness of the computer control.
Advantages include: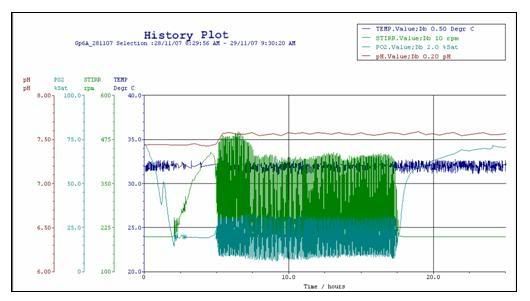
Part II (Growth Graph)
Part III (History Plot)
You are Here: Part IV (Futher Questions)
Day Three Part III
11:01:00 PMIntroducing to you the History Plot!A colourful graph was presented to us. From the lab technician, we found out that it was actually called the History Plot. (click to view enlarged image)
What the hell is a History PLOT??? The History Plot (from the title that is already so obvious) covers the past events of the fermentation process in the bioreactor. It records the major operational parameters during our fermentation process.
In our case, it consists of 4 major operational parameters. They are the pH level in red, dissolved partial oxygen level (PO2) in light blue, stirring speed in green, and temperature in dark blue.
The values of these parameters fluctuate due to the computer system trying to negate the changes in the parameters so that the optimal growth condition is maintained.
Overview of the graph:
• The lag phase for our group can be said to be extremely short which amounts to about 1.3 hours
• By cross referencing with the cell growth graph, the log phase starts, but the log phase is begins 1.3 hour after inoculation and lasts for 3.7 hours till the 5th hour.
• The stationary phase begins at around the 5th hour and ends around 17.5th hours.
• The death phase then follows.
Temperature:
The optimal temperature for cell growth (from 31.5˚C to 32.5˚C) was kept constant throughout by the automated system.
pH:
It is rather consistent throughout the lag and log phase but there is a slight increase in pH value as it transits from log phase to stationary phase. After which it remain relatively unchanged/constant. The sudden increase may be attributed to the toxins and the secondary metabolite.
pO2 level and Stirrer speed:
As observed, the stirrer speed is increasing rather consistently while the pO2 level remains constant. The reason being that this is the log phase.
During the log phase O2 demand level increases without the stirrer the pO2 level will drop consistently, however the automated system deems that the lower limit for pO2 level is 24% saturation. Therefore, to keep the pO2 at least at 24% saturation, the stirrer speed increases to make the dissolving rate of O2 equivalent to the O2 uptake rate. As the uptake rate and the dissolving rate is the same, the net change is zero. Hence the pO2 level remains constant during this period.
There are four sections to Day 3:
Part I (Procedures)
Part II (Growth Graph)
You are Here: Part III (History Plot)
Part IV (Futher Questions)
Day Three Part II
11:00:00 PMDay 3, Part II: Growth Graph
Discussion for Cell Growth
By plotting the cell growth curve, we can actually determine the:
1) Different stages of E.coli cell growth (lag, log, stationary, death)
2) Duration of the growth stages
3) Specific growth rate at a specific timing
To plot the curve, it is necessary to determine the cell concentration. On the other hand, to determine the cell concentration, the absorbance of the samples at every hour must be measured using a laboratory equipment known as the spectrophotometer ( refer to further questions for the principle of the machine).
Samples were extracted from the bioreactor 10 hours at every hour from 9am to 6pm (excluding the control sample) and the absorbance was taken.
The Beer-Lambert Law states that the absorbance of a material in solution is directly dependent on the concentration of that material.A α c The material in this case is the cell concentration (x). 

By comparing the two equations above, we can see that the efficient coefficient (ε) and the path length of the cuvette (l) are identical. Thus, the two equations can be combined into the equation below and the ε and l can be eliminated. 
From the cell concentration values, the values of Log (c/c0) or Log (x/x0) that we are required to find can be calculated so that the cell growth graph can be plotted.


From the graph plotted, only the exponential and the stationary phases could be observed. However, the lag phase and the death phase could not be seen and were not known. The slope of the exponential phase = μmax, which is the maximum cell growth rate. The slope of other parts of the curve = μ, which is the specific cell growth rate.
For the absence of the lag phase observed, one possible reason to support the observation would be due to the fact that the absorbance of the first fraction taken was right after the lag phase. Therefore the lag phase was not captured in this graph.
However, the lag phase can be deduced from the history plot (refer to the next page History Plot) which is 0.8 hours from the start (9am instead of 8.30am from the history plot).
Stationary phase, also called the idiophase, happened when cell growth was equal to cell death. This occurs at the 5th hour to the 17.5th hour (observed from the history plot) on the graph whereby the slope equals to zero. This phase occurred because the rate of cell growth is more or less equal to the rate of cell death, and can be triggered by the exhaustion of a particular critical nutrient essential for maintaining cell growth, or the accumulation of toxic metabolic products.
Finally, the death phase was not detected and could not be observed from the graph. It refers to the period of exponential decay and it occurs either due to the depletion of cellular reserves of energy or accumulation of toxic waste products.
Please refer to the History Plot for further details!
There are four sections to Day 3:
Part I (Procedures)
You are Here: Part II (Growth Graph)
Part III (History Plot)
Part IV (Futher Questions)
Back to Homepage
Day Three Part I
11:55:00 AMDay 3, Part I Experiment 3: Inoculation, Fermentation and Monitoring
During the third day, we carried out sampling, which was essentially done to monitor the growth of cells as well as the rate of product formation.
Objectives
1. To carry out scale-up fermentation process for GFP protein
2. To monitor cell growth and product formation through manual sampling and computer data loggingPart II of monitoring cell growth and product formation (sampling) 1. 10ml of blank sample were taken before inoculation and then one sample (10ml) every hour.
2. The fermentation broth was harvested after 24 hours of fermentation, and 10ml of culture was aliquot into a sterile, disposable test tube. The absorbance of the sample will be taken and the growth curve will be drawn out.
Tuesday, November 27, 2007
Day Two
11:47:00 AMDay 2
Experiment 3: Inoculation, Fermentation and Monitoring
Objectives
1. To carry out scale-up fermentation process for GFP protein
2. To monitor cell growth and product formation through manual sampling and computer data logging
Procedure for setting up the fermentation process (Part I):pH - 7.5Stirring speed - minimum 10%, maxiumum 90%, control to AUTOpO2 - 20%, control to AUTO, stir to "CASC" & "AIRFLOW" to "CASC"Airflow - minimum 25%, maximum 100%
Monday, November 26, 2007
Day One - Experiment Two
2:38:00 PMDay 1Experiment 2: Equipment, Media and Seed Culture Preparation
Objectives
1. To describe the steps to prepare a bioreactor2. To prepare the media for seed culture and scale-up fermentator3. To prepare seed culture for scale-up fermentation (1) For the preparation of the bioreactor:
1. The pH electrode was calibrated using standard buffer solution. .jpg)
3. The addition agent lines for acid, base and antifoam were connected and the levels in the storage bottles were checked. 5. The water jacket that was filled with water was checked. HCl will cause corrosion of the metal parts of the fermenter when it accidentally leaks out from the tubing which results in spoilage of the fermenter. (c) What is meant by polarization of the pO2 probe?Polarization of the pO2 probe meant that the oxygen level measured is only the measurement of the tested solution and not the measurement with that present in the electrolyte solution. (d) What is peristaltic pump? Peristaltic pump is apparatus consists of flexible tube inside a circular pump casing and a rotor with a number of rollers that are attached to the external ciircumference compresses the flexible tube. The rotor ensures that the fluid to be pumped is moving through the tube.1. All cables except the temperature probe were disconnected..jpg)
.jpg) (3) For the preparation of media:
(3) For the preparation of media:.jpg) (i) Explain the purpose of each ingredient found in the LB media.
(i) Explain the purpose of each ingredient found in the LB media.
Ingredients that are found in the LB media are:It is an enzymatic digestion of the protein to provide amino acids to the growing bacteria.NaCl provide sodium ions which are used for transportation and maintainig osmotic balance.The purpose of adding water is to suspend the solids.pH at 7.5 is optimal for cell growth.The purpose of ampicillin is to use it as a selective tool to allow growth of resistant E.coli and also to prevent other growth of other bacteria (lower the risk of contamination within the media). It acts as a inhibitor of enzyme transpeptidase in the synthesis of cell wall by gram positive bacteria and hence only allowing ampicillin resistance bacteria to grow.The temperature of 121 degree Celsius during autoclaving will cause the ampicillin structure to be denatured. This will cause ampicillin to loss its function.The purpose of arabinose acts as the regulatory control for the expression of the GFP gene. Hence, when bacteria were plated onto the LB agar containing arabinose, this will apear bright green. If arabinose is absent, colonies will appear white as the gene is turned off. The sterile technique used in seed preparation is the adition of ampicillin to kill of unwanted bacteria that may be present in the agar.This is to prevent longer lag phase for the bacteria to multiply. This is because bacteria will take time to adapt to its new environment. The action of adding bacteria directly to the fermenter may kill them as it will give "shock" to the bacteria.
Day One - Experiment One
11:08:00 AMDay 1Experiment 1: Familiarization with the Bioreactor and its Operation
Objectives1. To familiarize students with the parts and components of microbial and mammalian bioreactors2. To introduce the basic operation procedure of a bioreactor 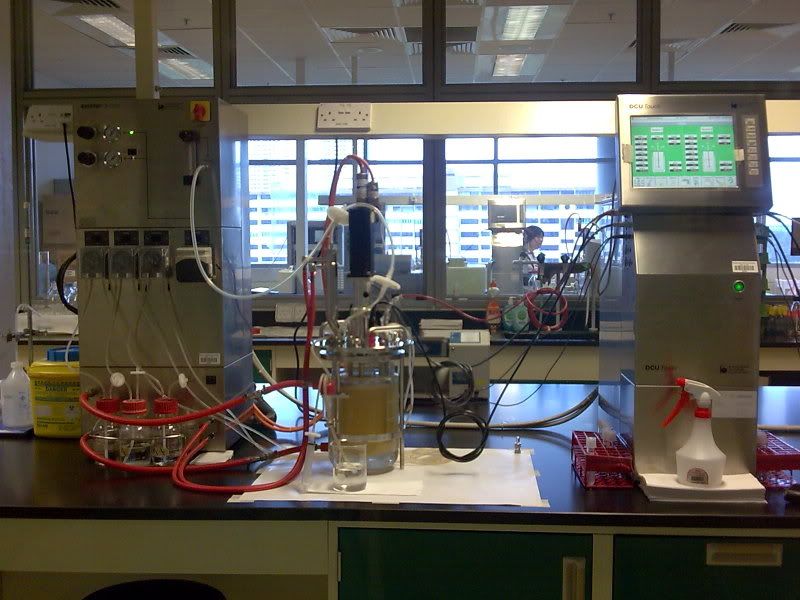
 *click on the photo to see the enlarged version
 Further questions...1. State the differences you observe between a microbial bioreactor and a mammalian cell bioreactor.
Microbes (such as bacteria) are mostly robust and able to resist shear damage. Hence, high-shearing radial impeller systems and high agitation rates can be used as part of the properties of the bioreactor. This provide high mass transfer capability and allow rapid metabolising with high-cell density microbial cell cultivations to be supported. Rushton turbines can be used to scale-up microbial cells.
However, mammalian cells are must more gentle and more susceptible to shear force thus gentle handling is required. Stirred tank bioreactors with marine-type impellers can be used to scale-up mammalian cells.2. Describe the typical activities that are performed on each stage in the fermentation process.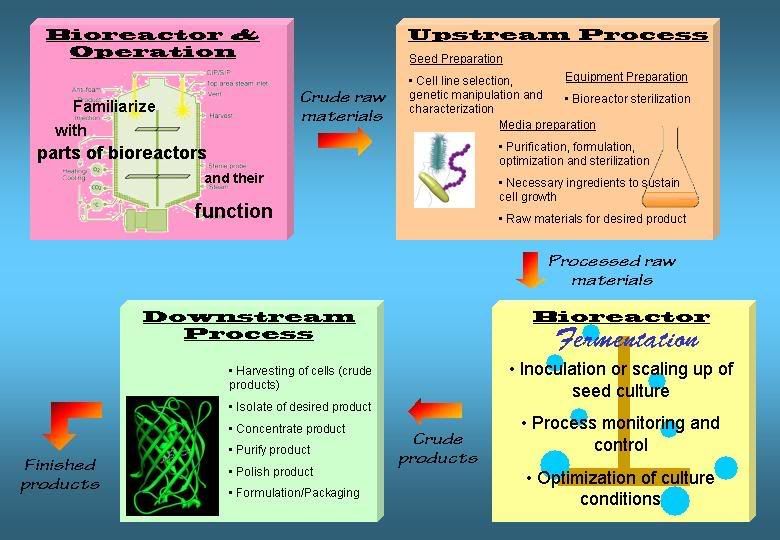
Friday, November 23, 2007
References
8:57:00 PMOne More Final Thanks...
Figure 1.1:
http://www.ens-lyon.fr/RELIE/PCR/ressources/apects_techniques/tp_gfp/GFPuv1.htm
http://www.biologicalprocedures.com/bpo/arts/1/40/m40f1lg.gif
http://www.sct.ub.es:802/Tutorial/imagenes/1EMBx500negropeq.gif
Figure 1.5:
http://fireflyforest.net/images/fireflies/2006/November/fluorescent-scorpion.jpg
http://www.mshri.on.ca/nagy/graphics/GFP%20mice.jpg
http://www.flickr.com/photos/adrianv/348308324/
http://upload.wikimedia.org/wikipedia/it/3/39/072_Tentacool.png
http://www.conncoll.edu/ccacad/zimmer/GFP-ww/GFP-1.htm
http://en.wikipedia.org/wiki/Green_fluorescent_protein
(Day 1 Experiment 1)
http://www.microbialcellfactories.com/content/5/1/21
(Day 1 Experiment 2)
http://www.newton.dep.anl.gov/askasci/bio99/bio99369.htm
http://www.bio-rad.com/LifeScience/pdf/Bulletin_9565.pdf
(Day 3 Experiment 3)
http://www.chm.davidson.edu/java/spec/spec.html
Tuesday, November 20, 2007
Anything about GFP
11:00:00 AMThe Secrets behind GFP But first! Before we proceed onto the experiment proper, it is essential that you must understand the history and the applications behind the protein that we worked with. In this section, you will find a summarized but detailed overview of the awe-inspiring Green Fluorescent Protein that we have all suffered worked hard for! This section encompasses: What exactly is GFP?History of GFPStructure of GFPApplications of GFPHow is GFP incorporated into Escherichia coli? Fig. 1.1 Section 1.1: What exactly is GFP?
Green fluorescent is a fascinating protein from a species of jellyfish, called Aequorea victoria that has been used in many applications as a tool in the field of biological science. It will result the conversion of blue protein, aequorin, into green fluorescent light by energy transfer. The fluorescence does not come from any chemical cofactor, but from an intrinsic fluorophore created by a cyclization reaction of polypeptide backbone.
The detailed mechanism on how aequorin is converted into green fluorescent light by energy transfer of GFP is shown in the diagram below: 

GFP has a unique can-like shape consisting of an 11-strand β-barrel with a single alpha helical strand containing the fluorophore running through the center. This protein contains 238 amino acids. Below is the beautiful structure of GFP... behold!  Fig. 1.4
With the advance of cloning technology, GFP can be introduced onto many types of living things to serve as an excellent marker for research study and diagnostic purpose. Some of these living things are bacteria, yeast, slime mold, plants, drosophila, zebrafish, and in mammalian cells. It can be used to localize proteins, to study the dynamics of the subcelular compartment to which proteins are targeted. It also reveals new insights regarding physiological activities of living cells.
Here are some animals fluorescing with a bright green glow when illuminated by long-wave ultraviolet light: 


Figure 1.7 shows "Alba" the green fluorescent bunny Figure 1.8
2. pGLO plasmid vectors are isolated from E.coli. pGLO plasmid vector contains two genes for selection, one is the ampicillin resistance gene which encodes for B-lactamase and another was the gene encodes for the regulation by the carbohydrate arabinose.
3. The released genomic DNA and pGLO plasmid vectors were then cleaved using the same restriction enzyme.
4. The cut genomic DNA and pGLO plasmid vectors were stitched together by using ligase enzyme.
5. The E. coli cells were being transformed by recombinant vector with gene of interest after ligation step.
6. Only the transformed E.coli cells would then be able to grow on Luria-Bertani agar plate with ampicilin and arabinose due to they contain the genes for selection. Other non-transformed cells would not grow.
8. Once the GFP-producing colonies were isolated, they are innoculated onto another agar plate (with same ingredients) to obtained pure cultures (enrichment method).
Back to Homepage